

Oct 24, 2022MSU develops apple fruit set prediction model
An updated apple fruit set prediction model is being developed by Michigan State University (MSU) researchers.
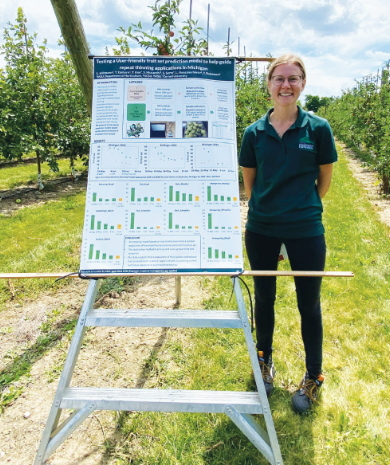
The model was presented at the Michigan Pomesters’ Ridgefest field day in late July, with participants touring research trials at MSU’s Clarksville Research Center.
Researchers acknowledged the fruit growth rate model for predicting apple fruit set developed by retired MSU Extension educator Phil Schwallier is fairly accurate, but it requires time-intensive fruitlet diameter measurements and data entry in limited adoption.
“We have developed a simple, time efficient fruit set prediction model to aid with thinner application decisions and inform future image analysis methods,” said Laura Hillmann, a Ph.D. candidate in associate professor Todd Einhorn’s lab in MSU’s Department of Horticulture.
Schwallier’s model establishes a value of an orchard’s 10% biggest fruit.
“You get your fruit set prediction by calculating how many fruit are less than 10% size of your biggest fruit in the sheet that Phil Schwallier had created for the fruit growth rate model,” Hillmann said. “With that approach, Initially, you have to select 100 spurs, tag them and mark down the individual flowers in the spur so that you can go back every three or so days and re-measure the same fruit so that you can create the repeated measures of diameter and get your growth rate for individual fruit. You then put the data into the Excel Sheet and get a fruit set prediction for a specific day in your thinning window. This can help guide thinning decisions within that window.”
The current project seeks to make the process more user friendly and less time consuming.
“While we’re basing everything on the same assumptions, the 10% biggest fruit, anything that is less than half the size of that will fall off,” Hillmann said. “It’s the same assumption, but the way we’re setting up ours is that you select 400 spurs. Instead of repeatedly measuring, you will sample 100 of those spurs, weigh them out and put the data of those weights into your Excel sheet and get the same prediction.”
Hillmann said users can input the resulting findings onto a scale, and connect a laptop to the scale.
“You put the fruit on the scale and print the (data) that will give you all of your weights in the row,” she said.
Hillmann said researchers have been testing both models side-by-side in Clarksville for the past three years.
“At least for the first two years, we could see how very well-aligned they are,” she said. “They both had a downward progression. Both models are always very close with the fruit set prediction. In 2020, actually, our model had a little better prediction to follow final fruit set. In 2021, we had a good line, as well.”
Hillmann said the 2022 findings “look a little wonky.
“I’m not sure exactly what happened. I still have to tease out that data,” she said. “We do still see this trend line in our model that we’re hoping to use to create an equation so we can predict the fruit set a little bit earlier. Right now, when we look at the comparisons between the two models we can see that our model is a little bit late in the fruit set prediction, or a little bit behind the fruit growth rate model.”
Leading into the current season, researchers have been testing the model in central Michigan.
“We went in and tagged all the spurs and came back to sample and weigh,” she said. “The progression toward the fruit set seemed to indicate that our prediction model was on track pretty well as we get along in the season.”
The newer model’s main time-saving feature is that researchers don’t have to go back to the original tree and measure the same fruit repeatedly.
“Also, we can harvest them in the morning and weigh them in the afternoon whenever we have time,” Hillman said. “That’s kind of the main positive point to this.”
Einhorn said that the approach automatically puts the data in an Excel file.
“You don’t have to find the fruit, you don’t have to re-measure it every time then enter all the data. We don’t have the time statistics, but I can tell you from doing it, it’s not even close,” he said. “It’s about every 3-6 days that you would do on the growth-rate model. Probably every three days. By six days in good conditions, you can pick up fruit drop. You can pick up a prediction to know if you can put a repeat application on.
“The key with this whole thing is we do our first measurement when the thinner’s applied, and it’s every three days,” Einhorn said. “If developmentally we’re OK, as long as we’re coming back again around 12-14 millimeters with the prediction, you can get another application (of chemicals).”
Schwallier, one of the farm cooperators on the project, said he is impressed with the results thus far.
—Gary Pullano, FGN senior correspondent
PHOTO: Laura Hillmann, a Ph.D. candidate in associate professor Todd Einhorn’s lab at Michigan State University’s Department of Horticulture, explains a new apple fruit set prediction model. Photo: Gary Pullano
Latest News
MSU funds climate projects
Custom Agronomics acquires BioTek Ag


Current Issue

On-farm AI: Water, farm, labor research guide decisions
Data collection tool expands farm management
Carmel Valley winegrapes: Parsonage Village Vineyard
IFTA Yakima Valley tour provides orchard insights
IFTA recognizes tree fruit honorees
Pennsylvania recognizes fruit industry professionals
Fresh Views 40 Under 40
see all current issue »


