

Nov 6, 2019Monitoring soil moisture for precision apple growing
Researchers at the Fruit Research and Extension Center are developing and evaluating a sensor-based irrigation system for specialty crops.
Working with growers to effectively implement a precision irrigation system is the major focus of these projects. In 2019, the focus is on monitoring soil moisture levels using pre-existing irrigation plans. At the end of the 2019 season, a comprehensive evaluation will be conducted to assess how soil water levels fluctuated over the season and the effectiveness of the existing irrigation plan, to provide further information for developing sensor-based irrigation systems in 2020 and beyond.
Sensor Components and System
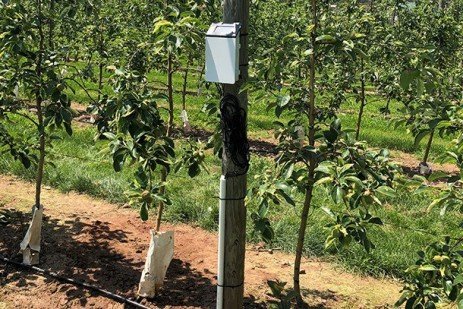
Each sensor station—one station per orchard at this time—consists of the following components pictured in Figure 1:
- Three Soil Water Content Sensors (Meter Group, Inc., TEROS 10)
- One Soil Water Potential Sensor (Meter Group, Inc., TEROS 21)
- One Sensor Datalogger (Meter Group, Inc., ZL6)
- Cloud-based Cellular Data Service (Zentra Cloud)
The movement of water occurs within the soil profile through the soil pore space, between the soil and plant roots and between the soil and the atmosphere. When considering irrigation needs, it helps to think of the water not only in terms of the total content of water in the soil but also in terms of the availability of that water. Soil water content is expressed on a volumetric basis, which measures the volume of liquid water per unit volume of soil (e.g., cm3 water per cm3 soil, or cubic inches water per cubic foot in U.S. customary units). Soil water potential is an expression of the energy state of water in the soil. Or in simplified terms, how much effort is required to pull water molecules off the surface of charged soil particles.
In our experimental design, three sensors are used to monitor soil water content in the root zone at one, two, and three-foot depths, and the water potential sensor is used as a reference to compare the two types of sensors. The sensors are connected to a datalogger, that monitors the output from the sensors regularly, for example, at ten-minute intervals.

Sensor System Installation
To access the soil moisture measurement data from a remote device such as a computer or tablet, the data logger must be able to communicate with the Zentra Cloud data server through a cellular connection. It is critical that cellular connectivity is checked before sensor purchase and installation. There are plenty of locations in Pennsylvania where service is spotty, particularly in the hills and mountains where cell towers may be blocked by geographical features.
At this time, the ZL6 data logger uses cellular service providers AT&T or T-Mobile. Before investing in equipment, test the signal strength of either of these two providers at the locations where the dataloggers will be installed. At least one “bar” of signal strength (20% or higher) must be present to take advantage of the real-time monitoring provided by the sensor stations.
To adequately measure soil moisture within an orchard block, one or more sensor stations must be installed in representative locations. A “representative” location is one where the drainage and retention conditions match the average conditions within the block. As of this time, there is no single rule for how manly sensor stations are required for a certain size of orchard block. In most cases, site selection and the number of stations to use will depend on observations of soil textures, topography, density and age of the planting, and personal experience.
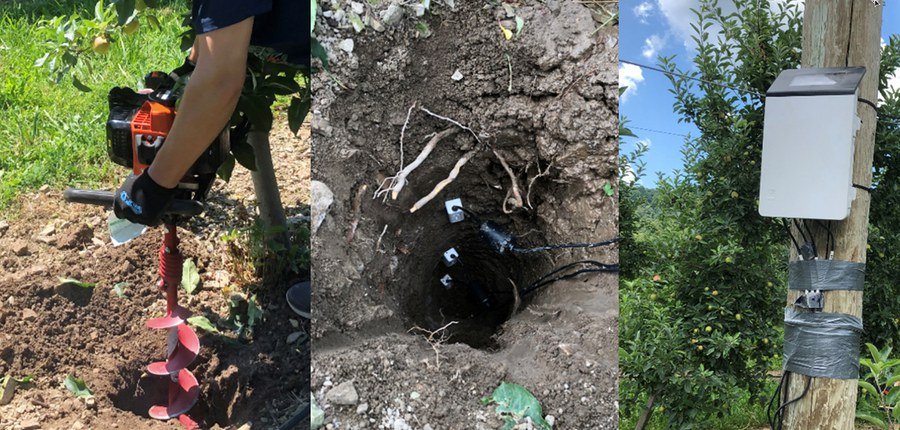
Installation begins by digging a hole (Figure 2) into which the sensors will be in contact with the soil. To cover the root zone for fruit trees, typically multiple sensors will be required to be installed at different depths. In our experiment, three content sensors have been placed at one, two, and three feet deep, and the water potential sensor at a depth of two feet.
Try to dig small holes to avoid big disturbances to the soil profile which alters the soil pore space. Firmly insert the prongs of the TEROS 10 into the undisturbed sides of the hole. The TEROS 21 sensor should be covered with moist soil before being laid into the hole at a depth of two feet. Additional installation requirements and recommendations can be found in the instructions supplied by the Meter Group, Inc.
Access Sensor Data Remotely
Data from the sensors is available immediately via a USB or Bluetooth connection from the datalogger. The Zentra Utility software for monitoring and configuring the datalogger via a laptop using these connections is freely available from The Meter Group.
To access the data remotely, create an account at Zentra Cloud. Create a profile that links your orchard with each ZL6 datalogger device to the Zentra Cloud service. Follow the step-by-step instructions to link the sensors in the orchard to your Zentra Cloud account. Data should begin uploading from the logger at the intervals set during the configuration step.
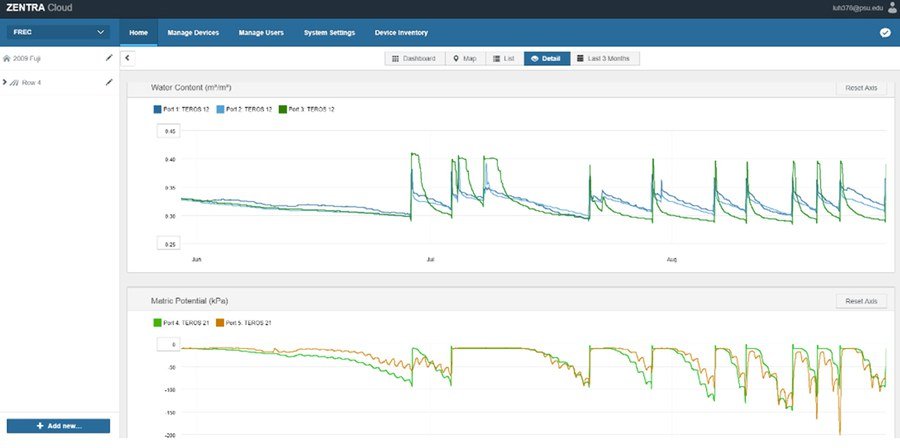
An example of data collected from a ZL6 and the online interface is shown in Figure 3. The sensor readings show the current sensor readings and also the curves for historical readings over a selected period. The data also can be downloaded and imported into common spreadsheet software.
Data Interpretation
As discussed above, the water content sensor (TEROS 10) reading indicates how much water is in the soil. (For example, 0.30 m3/m3, means 30% of a block of soil is water at the measured location).
The water potential sensor reading indicates the energy required to move the water from the soil to the plant, and the value is always negative. The smaller the absolute value is, the wetter the soil. For example, -10 kPa indicates very wet soil, while -80 kPa indicates that the soil is possibly a bit dry.
The purpose of irrigation is to keep the soil water content at its field capacity level. Too much water causes water/energy loss and nutrient loss, too little water causes plant stress. For different types of soil, the specific values for identifying wet or dry conditions with a soil water content sensor are different. Even at different depths within the same orchard, the values may vary.
To estimate the field capacity, two different methods may be employed. At the beginning of the season—before heavy demands for water by rapidly growing trees—apply full irrigation, for example, 6-8 hours of drip irrigation. Check the soil water content data after 12–24 hours. This will provide an estimated field capacity because excess water will have drained away and it is assumed little is lost to transpiration and evaporation.
A second method to identify the field capacity uses the TEROS 21 water potential sensor. Apply full irrigation as above. If the water potential remains at or near -10 kPa for 12–24 hours, then the corresponding measured water content value could be considered at field capacity.
The water potential sensor is less sensitive to the soil type/texture and is more representative of the availability of water to the plants. Normally, if the water potential is about -10 kPa, tree roots could get water from the soil very easily. As the value gets increasingly negative, the difficulty for roots to acquire water increases. For sandy soils or soils with rocks, when the potential drops to -30 kPa, it may be appropriate to consider starting the irrigation system. If the soil contains more clay, then the irrigation threshold could be set to -80 kPa or lower. However, it is also important to take into consideration the root zone of the soil and its depth. If the soil surface area (upper root zone) gets dry while the deeper soil remains wet, fewer irrigation hours may be necessary.
At this time, we are continuing to monitor soil moisture levels to provide better guidelines for operating an irrigation system. As more data becomes available, future developments will enable us to tie the sensor system directly into an electronic irrigation control system for fully automated irrigation control.
Acknowledgments
With the support from the SHAP research committee (2018-2020), and through Project No. LNE19-378-33243 from the Northeast Sustainable Agriculture Research and Education (SARE) program (2019-2021), we are developing and evaluating a sensor-based irrigation system for specialty crops.
We would like to give our thanks to our 2019 season collaborating farms who permitted us to access their orchards for installing sensors: EI Vista Orchards Inc., Hollabaugh Bros. Inc., Mount Ridge Farms, and Twin Springs Fruit Farm.
– Long He and Daniel Weber, PennState Extension


Current Issue

On-farm AI: Water, farm, labor research guide decisions
Data collection tool expands farm management
Carmel Valley winegrapes: Parsonage Village Vineyard
IFTA Yakima Valley tour provides orchard insights
IFTA recognizes tree fruit honorees
Pennsylvania recognizes fruit industry professionals
Fresh Views 40 Under 40
see all current issue »


